Research income of Uber drivers in Amsterdam: an analysis
There was a lot of commotion in the Netherlands last week about Maastricht University's research report "Uber app users, trips made, earnings and satisfaction". Newspapers headlined with 'even before publication controversial'. The coverage paid little attention to the difference between gross and net and media mainly used the publication as a reason to summarise the problems surrounding Uber. Dutch trade union FNV responded with the blog 'UBER CHEATS: How #Uber is cheating with supposedly 'independent scientific research'.
How reliable is the research? What was really in the report? And what didn't? I dove in.
Where did the report come from?
Although Uber regularly releases its own figures, the company is reluctant to commit to independent scientific research. This report is an exception. The Research Centre for Education and the Labour Market (ROA) is a research institute of the Maastricht University of Business and Economics.
Uber had to commission this research as part of agreements with the municipality of Amsterdam. This is because in 2019, the company entered into a 'Social Charter' with the municipality of Amsterdam around road safety, sustainability, data sharing and independent research. The trigger was that Uber drivers were involved in a number of traffic accidents, some of them fatal. So Uber had to commission research and came to ROA. A first version of the report was published in 2021, the final version came online last week.
How independent is the research?
You would expect that Uber would commission such a research by a commercial research firm. For the ROA, the collaboration did not seem obvious either: there is a considerable risk of detriment and other colleges and universities therefore thanked it.
The biggest objection for academics is that they cannot check the data provided by Uber. This makes it easy for opponents of Uber to question the results and impossible for other researchers to replicate the calculations. On the other hand, this study was a great opportunity for science, as data on platform work is generally not accessible.
The researchers performed their task thoroughly. The research design and execution are insightful. And the results are not overwhelmingly positive for Uber.
What was the research about?
The ROA investigated:
- Working hours and earnings of taxi drivers using the Uber app and changes over time;
- Satisfaction of drivers using Uber app;
- Motives for drivers to use the Uber app in Amsterdam.
ROA calculated the number of taxi rides and earnings using a dataset provided by Uber. That covered all rides within, to and from the municipality of Amsterdam between January 2016 and August 2022. They did the satisfaction study based on the results of a survey Uber sent to 3,622 drivers.
Collateral insights
The nice thing about these kinds of surveys is that there is always an interesting bycatch of insights. For instance, you can read in the report how rides are distributed within the Amsterdam municipality, how activity differs per part of the day and insights around hiring and cancelling rides.
In addition, you can clearly see the impact of the corona crisis on the platform's activities in the Amsterdam municipality. Everyone already thought it was substantial, but how big exactly was not clear. Moreover, the data also shows what impact the various corona waves, restrictions and loosenings had.
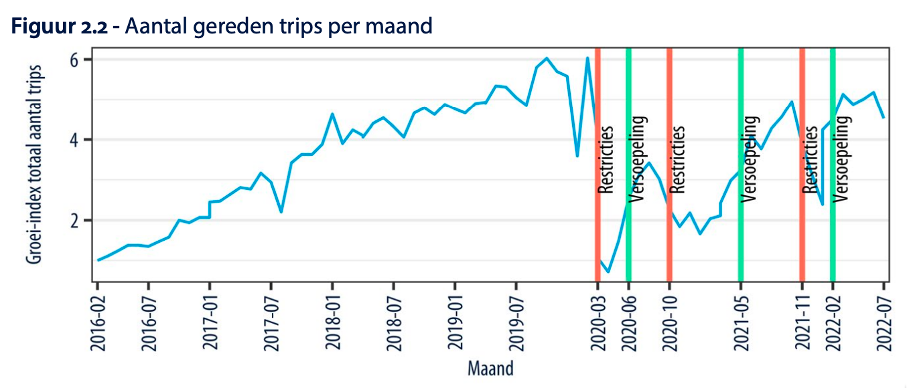
Despite the heavy impact of corona, Uber use in the Amsterdam municipality has grown substantially since 2016.
From the report, "The number of drivers using the Uber app has steadily increased from 1,382 in February 2016 to 5,217 in December 2019. After the corona pandemic, there are fewer drivers using the Uber app: 3,979 in August 2022. The number of trips made is 6 times higher in February 2022 than it was in February 2016."
That means Uber has more drivers in Amsterdam than taxi firm TCA, for which 1,500 self-employed drivers drive. This does not necessarily mean that Uber is bigger than TCA. We can only find that out when we know how many hours drivers from both parties are collectively available.
The survey also shows that taxi drivers use Uber in very different ways. Some drivers only use the Uber app to fill empty spaces, while others drive structurally via the app. The survey reveals the following facts about Uber taxi drivers:
- Almost half have other earnings besides their income through Uber as employees or self-employed;
- 36% work exclusively through Uber;
- 54% use another app besides Uber to get rides;
- 47% have taxi-related income from their own network and clientele in addition to Uber (and are online 56 hours less than drivers without income from taxi work from their own network and clientele).
What are Uber driver's gross earnings?
The survey also offers insight into hourly rates. Het Financieel Dagblad (FD) writes that "last year, an average Uber driver in Amsterdam spent no more than 25 hours a week online and earned over €32 gross per hour". According to the newspaper, Uber drivers therefore earn around €30 to €35 per hour, which the Dutch Social and Economic Council in 2021 "put forward as the lower limit for self-employment" in the debate around false self-employment.
That conclusion is a bit short of the mark. Answering the question 'what does an Uber driver earn' is also not straightforward. What exactly is working time? The time a driver is 'online' is not a reliable measure. After all, a driver may have multiple apps open, may also have his own customers or be selective on rides. The time a driver actually performs a ride also gives a skewed picture, as commuting and administration are also working hours. But no figures are available on that.
Tips, promotions and different types of rides
Furthermore, it is debatable that the researchers arrive at an hourly rate based on the fare plus promotions and tips. Tips and promotions are actual income, but they are rewards that a driver cannot rely on. Remove tips and promotions from the average income, leaving €29.51.
It is also not clear why the researchers grouped all types of Uber services together. Why were they not broken down into Uber X, Van and Black? According to Uber, this makes little difference, but that cannot be verified. That calculation is missing from the report.
Big differences
Drivers spend an average of 25 hours a week online via the Uber app, but there are big differences. The graph below provides insight into this. This information is essential to the debate on fair pay for taxi drivers.
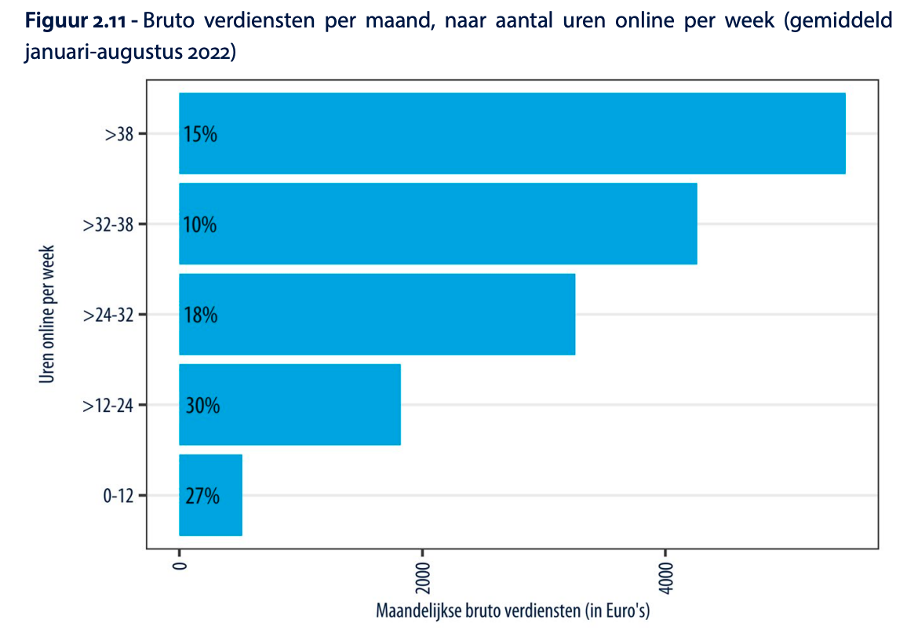
Uber writes in its own blog about the survey, "A quarter of all drivers earned less than €24.27 per hour online. On the contrary, another quarter earned more than €38.36 per hour online."
This big difference, according to Uber, is due to three variables:
- Accepting and exiting rides
- Offering different services
- Where, when and how much you drive
Variable 1 is particularly interesting. If you accept few rides, it makes sense that the hourly rate is lower. Uber illustrates this in its own blog with two extremes:
"The 500 drivers who most often accepted and rode out offered rides earned over €35 per hour online. On average, they drove 78% of the rides offered to them. The 500 drivers who accepted and drove the least often offered rides earned over €17 per hour online. On average, they drove only 2% of the rides offered to them. For example, among them is a driver who was offered as many as 14,498 rides during this period and drove only 9 of them."
32 euros an hour? A distorted figure
The average rate gives a distorted picture. Moreover, the average hourly rate from Uber's and ROA's press release is subject to quite a few variations.
This is because the €32 per hour is calculated over half a year, the period February 2022 to August 2022. This is only 9% of the total period measured (6.5 years). That period has been significantly affected by the coronapandemic, in several ways.
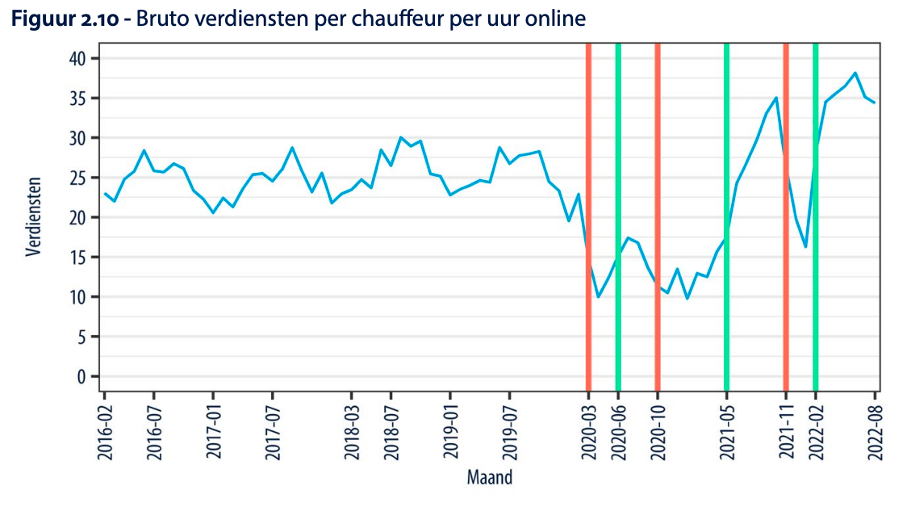
Before covid, the hourly rate was much lower. This is explicitly described in the report: "Drivers' gross hourly earnings averaged €24.91 in 2016. During the first corona year 2020, the average was €14.81 per hour. In 2022, we see the highest average gross hourly earnings of €32.32." In the first report in 2020, the following was still written down about the gross rate: "Drivers' gross earnings per hour averaged €22.34 in 2016 and averaged €22.85 in 2019."
So earnings for drivers are on the rise, but no one can say what this will be like a year from now. The new report also says: "It is possible that the higher earnings in 2022 can be explained by the smaller number of drivers post-covid19 driving a number of journeys that in 2022 is almost equal to the pre-covid19 level."
Although the researchers are transparent about this, you don't see it reflected in news reports and reactions. This is because those are mostly based on the press release, which only mentioned the €32. I find it somewhat opportunistic to include an average rate in a press release about a study that covers only a very small part of the measured period.
Is gross really gross?
The average hourly rate of €32 is a gross amount. From this hourly rate, many expenses still have to be paid: car, fuel, maintenance, insurance, pension, administration costs and so on. A taxi driver generally has higher costs than, say, a self-employed accountant or self-employed copywriter.
So the FD cannot simply compare this amount to the SER guideline. At the very least, you would have to deduct the direct costs of driving a taxi from this before you have a gross amount that can be compared with that of other self-employed workers.
More comments are possible. Why in the report, where the word 'earnings' is in the title, is nothing written about net earnings? After all, this has also been researched. It is very interesting to dig through the 'memorandum on Uber taxi drivers' by the City of Amsterdam. This extensive memorandum juxtaposes the figures from Uber, FNV and Maastricht University and calculates the variables to a net calculation. In one calculation, FNV came up with monthly costs of 1,510 euros per month, where this FNV report, according to the memo, does not economically estimate the costs.

Subtract that, plus a reservation for holiday, sickness, disability, pension and tax, from the gross monthly amount and you know what an Uber driver has left in the hand per month. Not fat, although the taxi collective agreement is not exactly lavish either.
The risk on the driver's shoulders
Furthermore, this research confirms that the risk of no work still lies with the driver. This can be clearly seen in the chart shown earlier showing gross earnings per driver per hour online.
Since a taxi driver has fixed costs per month (over 50% of the costs continue monthly, even if you are out of work), the net loss for drivers will be many times higher. In bad times, the fixed costs will have to be spread over fewer trips, putting a lot of pressure on the margin for the driver. The question is, however, to what extent this applies specifically to the driver who drives via Uber, or whether this is a problem for self-employed drivers in general. The risk will be greatest for a driver betting on 1 horse, although that is a basic rule that any entrepreneur will agree to.
How does this report contribute to the debate on platform work?
As you have read, there is much more information in this research report than the press release suggests. It is a thorough study, about which a very selective news release has been put out. For the discerning reader, it offers valuable insights that contribute to a richer debate.
It is remarkable that almost everyone responds to this press release without critically reading the study and the earlier research and notes. It is natural that the interpretation of variables and figures may lead to different insights and outcomes. That is fine, as long as you are not selective on the facts to support your own point of view.